v0.10 adds a library-first ops surface (ADR 027): portable inspect APIs, documented telemetry, optional metrics/LiveDashboard, and Mix tasks. There is no Rheo control plane and no second settle path.
Dead letters (DLQ)
DLQ means dead-letter queue: deliveries that stopped being retried for a
group — typically after Rheo.reject/3 or after nack exhausted
:default_max_attempts. The event stays in the stream; only that group’s
delivery record is marked dead-lettered (backends differ in storage shape;
Redis may use a separate DLQ stream).
Ops surfaces expose this as dead_letters, dead_letter_count, or a short
dlq= label. Listing is read-only. To reopen work, use Rheo.replay/3 or
Rheo.reset_group/3 (confirm: true) — never settle from a dashboard.
Inspect APIs
{:ok, streams} = Rheo.list_streams(rheo: MyRheo)
{:ok, groups} = Rheo.list_groups("orders", rheo: MyRheo)
{:ok, dead} = Rheo.dead_letters("orders", "risk", limit: 50, rheo: MyRheo)
{:ok, info} = Rheo.group_info("orders", "risk", rheo: MyRheo)
# info.lag, info.inflight_count, info.dead_letter_count
Custom backends that omit the optional callbacks get {:error, :unsupported}.
Shipping backends (ETS, Mnesia, Mongo, Ecto, Redis) implement them.
Inspect is read-only. To recover work, use Rheo.replay/3 /
Rheo.reset_group/3 (confirm: true) — never settle from a dashboard.
Mix tasks
mix rheo.streams --rheo MyRheo
mix rheo.lag orders risk --rheo MyRheo
mix rheo.group_info orders risk --rheo MyRheo
mix rheo.dead_letters orders risk --limit 20 --rheo MyRheo
mix rheo.bench --count 2000
mix rheo.bench reports relative ETS throughput only (not SLOs).
Telemetry
See Rheo.Telemetry for the full event list. Counters of note for ops:
[:rheo, :dead_letter]— poison path[:rheo, :lease]/[:rheo, :redelivery]— delivery pressure- span stops on
:append,:fetch,:ack
Optional definitions when telemetry_metrics is in the host:
{:telemetry_metrics, "~> 1.0"}

Rheo.Telemetry.Metrics.metrics()
Wire those into PromEx / LiveDashboard metrics / any reporter. Alert thresholds stay in the host (no Rheo Nagios binary).
LiveDashboard (optional)
{:rheo, "~> 1.0"},
{:phoenix_live_dashboard, "~> 0.8"}
# config.exs
config :rheo, Rheo.LiveDashboard, rheo: MyRheo
# router
live_dashboard "/dashboard",
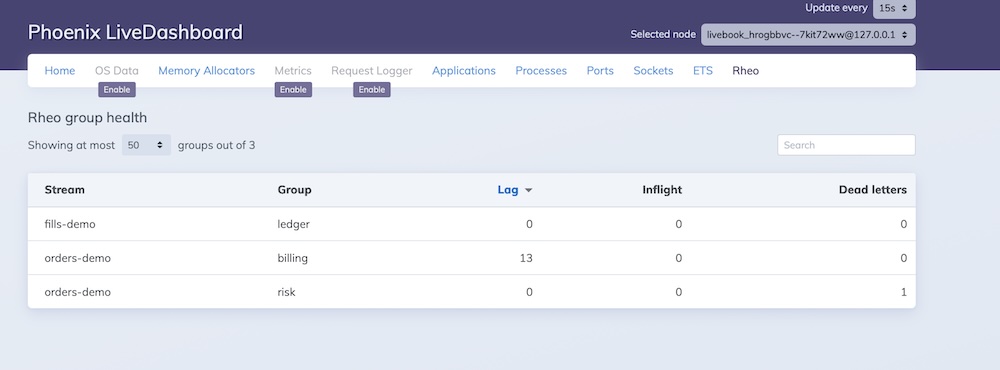
additional_pages: [rheo: Rheo.LiveDashboard.Page]The page shows group health (lag, inflight, dead letters). It does not ack/nack/reject.
Try it without a Phoenix app
Single-file host via Phoenix Playground:
iex examples/live_dashboard_ops.exs
# or Livebook:
livebook server notebooks/live_dashboard.livemd
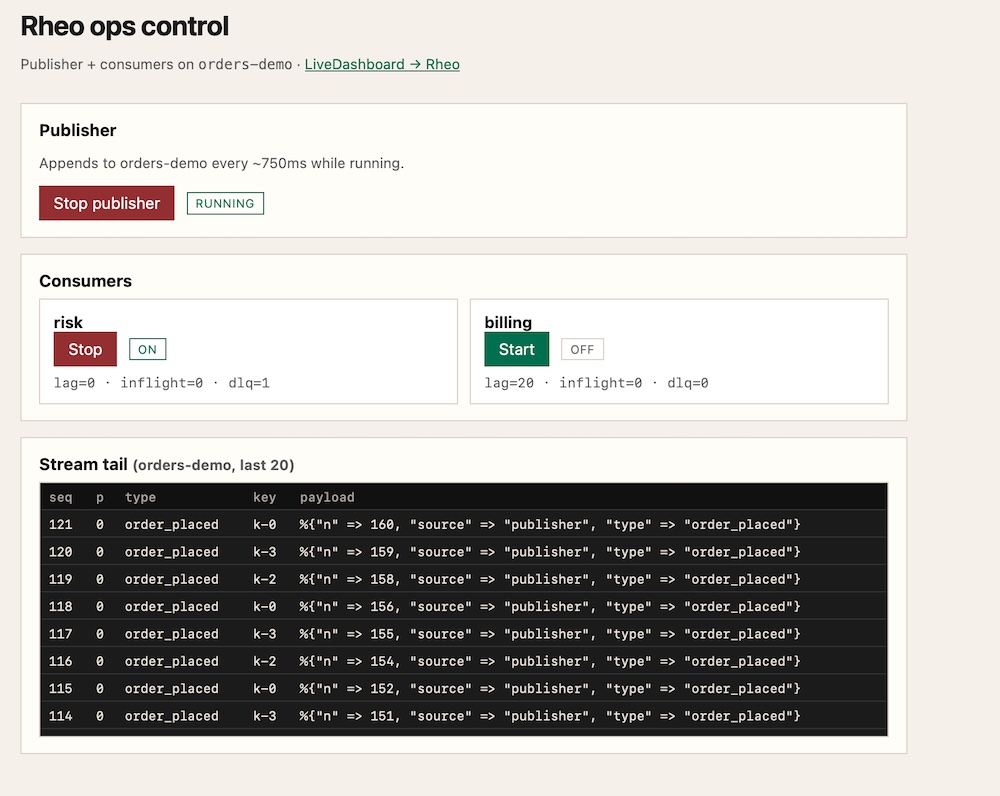
Opens a control panel at http://localhost:4000/ (toggle publisher /
consumers, stream tail) and LiveDashboard at /dashboard/rheo, seeded on ETS.
What is out of scope
Purge/delete stream, backup/restore, ad-hoc “fetch as ops CLI”, cluster reports, and a standalone Rheo server remain deferred.